Basics of Winning The Lottery with Math, Stats and Patterns
If you don't know how you can actually improve your odds of winning using real math, stats, and patterns, we recommend that you read these two articles from Lotterycodex:
- How to Win the Lottery According to Math and
- The Winning Lottery Formula Based on Combinatorics and Probability Theory
They will explain the basics of how to win the lottery using mathematical probabilities and combinatorics. So we won't repeat them here.
While these are great for a foundation, they are not sufficient. We went one step further than just math. We designed the most advanced, automated lottery analytical engine to help you win the jackpot!
|
Table of Contents 1. Takeaways from Lotterycodex 2. Are There More to Just Math? 3. Hot and Cold Number Patterns 4. Prime Numbers Patterns 5. Sum of Winning Numbers |
Takeaways from Lotterycodex
From these two articles, you know you should:- Choose the lottery with better odds
- Play combinations with better odds
- Make balanced odd and even numbers in your combination
- Make a balanced mix of low and high numbers in your combination
- Use advanced combinatorial and probability analysis
- Use a lottery wheel that uses combinatorial math and probability theory in one system
- Avoid the improbable

Lotterycodex, Lottometrix, and similar sites simply use the famous mathematical computation patterns from Renato Gianella’s study, the Geometry of Chance.
While these sites help you choose the #1 pattern based on the study. There is one big problem. The best pattern only covers 2.98% (6/45) and 2.9% (6/49) of the draws. You will be playing for a long time before you win anything.
Remember:
probability = chance (you have no control over this)
odds = advantage (you can choose a better ratio of success to failure)
What we want to do here is to build upon the study with real-life lottery statistical analysis and increase your odds of winning.
It is true that all numbers have the same probability. However, all combinations DO NOT have the same odds.
Are There More to Just Math?
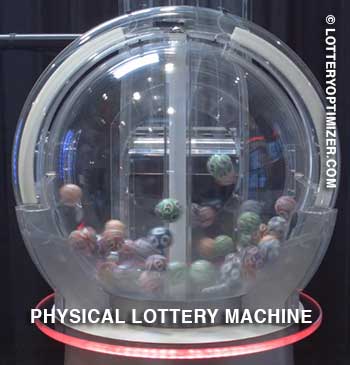
Lotterycodex mentioned that they don't use statistics to predict the outcome of the lottery draws. That is true in an ideal world when there are no external variables (biases) interfering with mathematical probabilities.Think about it, in your favorite lottery game. What type of machines are being used in the different lotteries? Do the balls always go into the rolling drum in the same order, or do they change it every time?
What about the rolling speed? Is it always the same? Is it even constant during the entire drawing?
And the balls? Are they used for a decade before being replaced by new ones, or are they constantly thrown away?
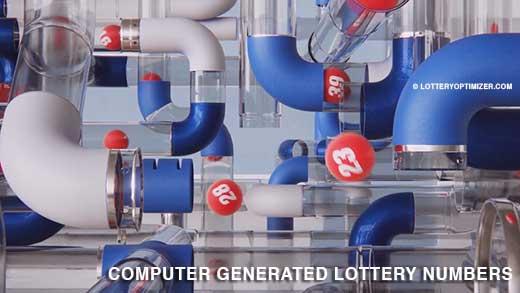
If the numbers were randomly generated by a computer, would different programs and algorithms produce similar results?
All these variables may have an effect on the lottery results. If these variables show a consistent pattern over time, they are considered "biased". These variables HAVE THE POTENTIAL TO AFFECT THE PATTERNS OF A SPECIFIC LOTTERY.
As a result, a 6/45 lottery in Australia would not have the same optimal group patterns as a 6/45 lottery in the U.S. It would be unwise to use a lottery program that claims to work with every lottery.
Another example of why statistics for a lottery game matter. Ask yourself a simple question. Will you choose exactly the same numbers as in a past winning draw? The answer would be a resounding "NO."
The bottom-line is, it is all about mathematical probabilities and patterns of a particular lottery. Statistics from past winning draws can actually tell you a lot about the patterns of a lottery.
These statistical patterns can be used to further analyze and choose optimal combinations along with mathematics and combinatorics.
Remember that "all numbers have the same probability, but not all combinations".
Hot and Cold Number Patterns
You may think that because some numbers are "hot", they will appear more often. The answer is no. All numbers have an equal probability of occurring. It is all about patterns.But what if we told you that there are actually patterns in the hot and cold numbers of the draws? Wouldn't it be just the same as grouping the numbers and trying to determine the patterns?
The numbers are "hot" or "cold," not because they really are hot or cold. In random draws, there is no such thing as hot or cold numbers. They will all come out quite even eventually.
However, external variables such as the changing of the lottery balls or computer algorithms may produce bias towards certain numbers. We won't know until we analyze the stats. This is the only reason why we are examining hot and cold numbers.
Take, for example, a mathematically optimized combination was created according to all the rules mentioned. But they all happened to be part of the top 12 hot numbers or part of the 12 cold numbers.
What are the odds that this combination will win the jackpot? In Australia's TattsLotto's past 520 draws (10 years), that never occurred.
Australian TattsLotto
March 26, 2011 to March 6, 2021
| No. of Hot Numbers in a Draw | Frequency |
|---|---|
| 0 | 58 |
| 1 | 164 |
| 2 | 182 |
| 3 | 88 |
| 4 | 27 |
| 5 | 1 |
| 6 | 0 |
| No of Cold Numbers in a Draw | Frequency |
|---|---|
| 0 | 86 |
| 1 | 195 |
| 2 | 168 |
| 3 | 64 |
| 4 | 7 |
| 5 | 0 |
| 6 | 0 |
From the statistics, in the past 520 draws, there was never a draw that had all six numbers in the top 12 hot numbers or top 12 cold numbers.
In fact, there was only one draw having five numbers in the top 12 hot numbers and no draws having five numbers in the top 12 cold numbers group in the last 10 years.
So would you choose a mathematically and combinatorially optimized combination that has 6 or 5 numbers in the top 12 hot or cold number groups? The answer is "no." because the odds of that occurring are extremely low.
In the Lottery Optimizer, the analytic engine will not simply look at the historical hot and cold numbers. In order to find the best combinations, it will compare historical and current hot and cold numbers trends.
Prime Numbers Patterns
How about prime numbers? Take 6/45 or 6/49 games, for example. The prime numbers are all odd, except 2. Surely, it won't pass the odd and even combination test.Prime numbers are simply another group of numbers, mostly a sub-set of odd numbers. It doesn't really matter mathematically when drawing random numbers. The only reason we look at this is to ensure randomness in the number selection.
By looking at the following chart showing the number of prime numbers in each draw in the past 520 draws of Canada Lotto 6/49:
Canada Lotto 6/49
June 26, 2016 to June 5, 2021
| No. of Prime Numbers in a Draw | Frequency |
|---|---|
| 0 | 44 |
| 1 | 156 |
| 2 | 198 |
| 3 | 93 |
| 4 | 25 |
| 5 | 4 |
| 6 | 0 |
How many prime numbers do you think you should include in your number selection? Do you see a pattern?
This actually matches with the mathematical probabilities of the number of odd and even number combinations. We know that 3 even and 3 odd have the highest probabilities. Since prime numbers are a sub-set of mostly odd numbers, we expect the most common number to be around 2.
If you wanted the highest odds of winning the jackpot, you would say either 1 or 2, maybe 3 prime numbers. This will further ensure randomness and that your combinations actually follow the probabilities.
Sum of Winning Numbers
You may wonder what the sum of the winning numbers has got to do with the winning patterns. What if we told you that the sum of the winning numbers seems to be falling within a certain range?The reason we look at this is that it is simply based on mathematical and combinatorial probabilities. It is certainly not a new "discovery" as claimed by some lottery "experts".
We will analyze a real world scenario, TattsLotto, a 6/45 game. The lowest and highest sums you can get are as follows:
1 + 2 + 3 + 4 + 5 + 6 = 21
45 + 44 + 43 + 42 + 41 + 40 = 255
So, any combination you ever pick will always be summed up to a value between those two.
That means all the 8,145,060 combinations that are possible in a 6/45 game will always produce a sum between 21 and 255.
Now that we have calculated the highest and the lowest points, let’s find the middle point, the more balanced result between the two:
255 (highest) – 21 (lowest) = 234 (all possible difference results between highest and lowest)
234 / 2 = 117 (half of the difference)
117 + 21 (lowest possible sum) = 138 (middle point)
Now, the first thing you’ll notice is that not all sums are equally possible.
1 + 2 + 3 + 4 + 5 + 6 = 21
1 + 2 + 3 + 4 + 5 + 7 = 22
1 + 2 + 3 + 4 + 5 + 8 = 23
1 + 2 + 3 + 4 + 6 + 7 = 23
1 + 2 + 3 + 5 + 6 + 7 = 24
1 + 2 + 3 + 4 + 6 + 8 = 24
1 + 2 + 3 + 4 + 5 + 9 = 24
There is only one possible combination to sum 21, and only one combination will give you 22. But there are two that result in 23 and three that result in 24. The same thing happens the other way around.
45 + 44 + 43 + 42 + 41 + 40 = 255
45 + 44 + 43 + 42 + 41 + 39 = 254
45 + 44 + 43 + 42 + 41 + 38 = 253
45 + 44 + 43 + 42 + 40 + 39 = 253
45 + 44 + 43 + 42 + 41 + 37 = 252
45 + 44 + 43 + 42 + 40 + 38 = 252
45 + 44 + 43 + 41 + 40 + 39 = 252
The number of possible combinations that add up to a certain sum value increases as you move away from the extreme points (highest and lowest) and closer to the middle-point, in this case 138.
In fact, if we take the sum results of all the 1782 draws that happened between 1986 and 2020 in TattsLotto, and we calculate the average of those sums, the result is 137.4567, which means 138!
One thing we learn from this is that the sum of the combinations you are going to play should not be too close to the extreme points (21 and 255).
In fact, there is a range where 85% of all the winning number sums fall! Will you rather choose numbers that fall into the 85% range or the other 15%?
If the sum of the numbers you choose falls within the 85% range, you have just increased your odds by eliminating 15% of the less likely combinations! :)